This column is a follow up to this column on how Thailand is at the Bottom of the Global Creativity Index’s ‘ethnic and religious tolerance’ indicator, on which Thailand ranked 127th out of 130 countries. The importance of creativity is that it is linked to growth, especially in cities, where a cosmopolitan mix lends itself to dynamism.
While researching how the Global Creativity Index, one thought stood out: the fact that this is only a single indicator. In order to understand the extent to which racism and xenophobia in Thailand are changing, and how Thailand compares to other countries, it is best to choose as many indicators as possible. This line of inquiry led to two major datasets, the World Values Survey Database and the European Values Study. The quality of data for these databases is, generally, excellent, with large, randomized samples. The samples for Thailand taken for the WVS were undertaken by the King Prajadhipok Institute.
To begin with, it is possible to extract four questions related to racism and xenophobia from the World Values Survey and to compare the periods 2005-2009 (Wave 5, specifically 2007 for Thailand) and 2010-2014 (Wave 6, specifically 2013 for Thailand), the only two periods for which there is data for Thailand. These questions are covered in turn below.
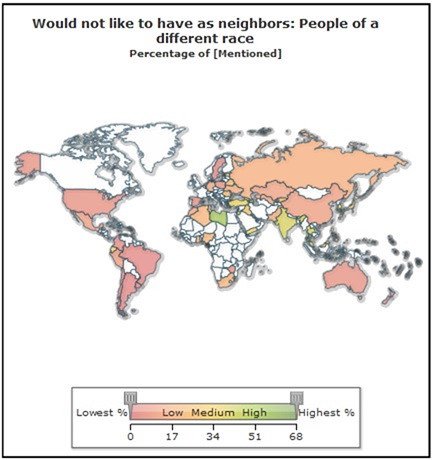
1) On this list are various groups of people. Could you please mention any that you would not like to have as neighbors? (People of a different race)
For this question, Thailand in 2013 scores in the lowest quintile out of 59 countries, with only India, Palestine, Libya and Azerbaijan being more racist/xenophobic. This can be seen in the below map.
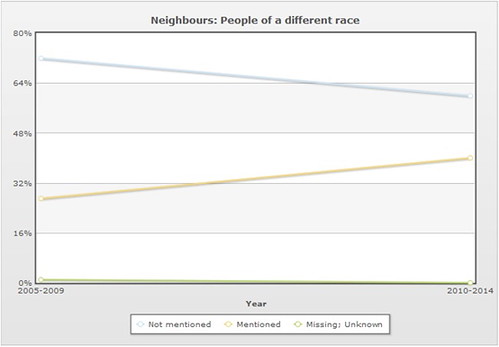
Unfortunately, Thailand has become more xenophobic according to this question since Wave 5. This can be seen in the ‘valid percent’ increasing in the following two tables:
Would not like to have as neighbors: People of a different race
WVS5 (2007)
|
Value Label |
Value |
Frequency |
Percent |
Valid Percent |
|---|---|---|---|---|
|
Mentioned |
1 |
417 |
27.18 |
27.47 |
|
Not mentioned |
2 |
1101 |
71.77 |
72.53 |
|
Total |
1518 (from 1534) |
98.95 |
100.0 |
|
WVS6 (2013)
|
Value Label |
Value |
Frequency |
Percent |
Valid Percent |
|---|---|---|---|---|
|
Mentioned |
1 |
478 |
39.83 |
39.83 |
|
Not mentioned |
2 |
722 |
60.17 |
60.17 |
|
Total |
1200 |
100.0 |
100.0 |
|
The difference between the valid percent is statistically significant at p <0.05 (P=<0.0001) z value -6.8088 (2-sample z-test [two-tailed]). This can be represented visually:
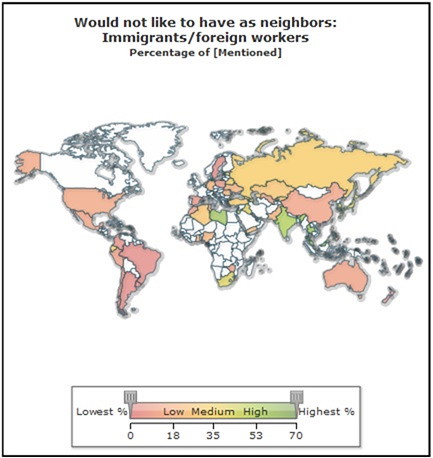
2) On this list are various groups of people. Could you please mention any that you would not like to have as neighbors? (Immigrants/Foreign Workers)
For this question, Thailand in 2013 scores in the lowest quintile out of 59 countries, with only Libya and Malaysia being more racist/xenophobic. This can be seen in the below map.
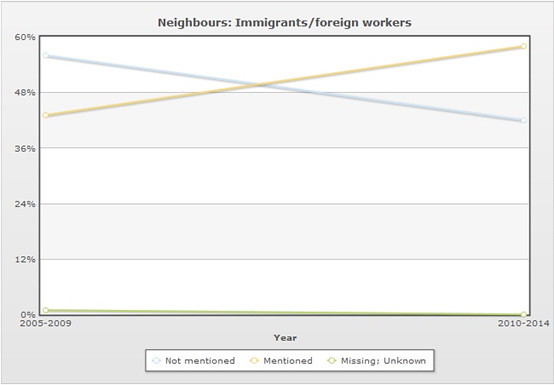
Unfortunately, Thailand has also become more xenophobic according to this question since Wave 5. This can be seen in the ‘valid percent’ increasing in the following two tables:
Would not like to have as neighbors: Immigrants/foreign workers
WVS5 (2007)
|
Value Label |
Value |
Frequency |
Percent |
Valid Percent |
|---|---|---|---|---|
|
Mentioned |
1 |
661 |
43.09 |
43.43 |
|
Not mentioned |
2 |
861 |
56.13 |
56.57 |
|
Total |
(1522 (from 1534) |
99.22 |
100.0 |
|
WVS6 (2013)
|
Value Label |
Value |
Frequency |
Percent |
Valid Percent |
|---|---|---|---|---|
|
Mentioned |
1 |
699 |
58.25 |
58.25 |
|
Not mentioned |
2 |
501 |
41.75 |
41.75 |
|
Total |
1200 |
100.0 |
100.0 |
|
The difference between the valid percent is statistically significant at p<0.05 (P=<0.0001) z value -7.6777 (2-sample z-test [two-tailed]). This can be represented visually:
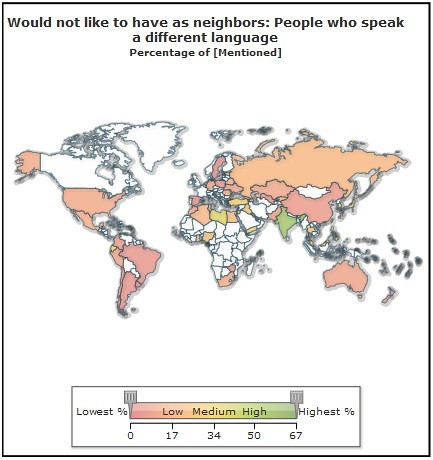
3) On this list are various groups of people. Could you please mention any that you would not like to have as neighbors? (People who speak a different language)
For this question, Thailand in 2013 again scores in the lowest quintile out of 60 countries, its best performance, with Kuwait, Malaysia, Turkey, the Philippines, Yemen, Lebanon, South Korea, Ecuador, Palestine, Libya and India being more racist/xenophobic. This can be seen in the below map.
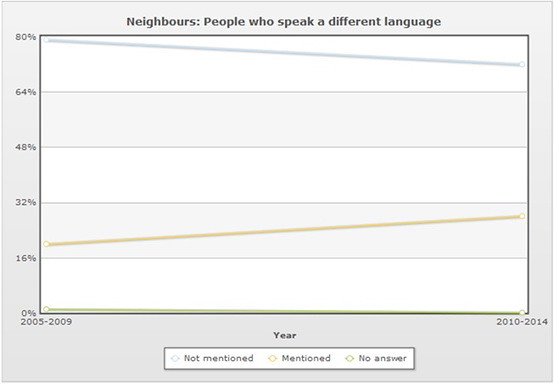
Unfortunately, Thailand has again become more xenophobic according to this question since Wave 5. This can be seen in the ‘valid percent’ increasing in the following two tables:
Would not like to have as neighbors: People who speak a different language
WVS5
|
Value Label |
Value |
Frequency |
Percent |
Valid Percent |
|---|---|---|---|---|
|
Mentioned |
1 |
308 |
20.08 |
20.30 |
|
Not mentioned |
2 |
1209 |
78.81 |
79.70 |
|
Total |
1517 (from 1534) |
98.89 |
100.0 |
|
WVS6
|
Value Label |
Value |
Frequency |
Percent |
Valid Percent |
|---|---|---|---|---|
|
Mentioned |
1 |
342 |
28.50 |
28.50 |
|
Not mentioned |
2 |
858 |
71.50 |
71.50 |
|
Total |
1200 |
100.0 |
100.0 |
|
The difference between the valid percent is statistically significant at p<0.05 (P=<0.0001) z value -4.9754 (2-sample z-test [two-tailed]). This can be represented visually:
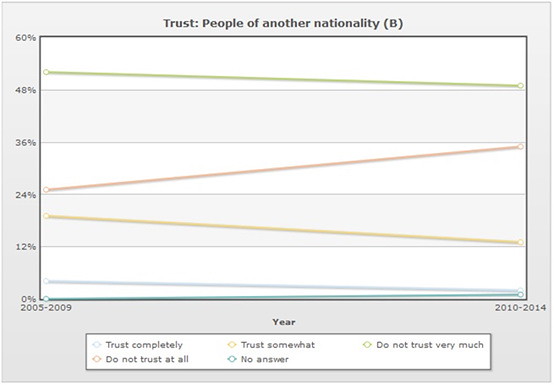
4) I’d like to ask you how much you trust people from various groups. Could you tell me for each whether you trust people from this group completely, somewhat, not very much or not at all? (People of another nationality)
For this question, Thailand in 2013 again scores in the lowest quintile out of 58 countries, with only Malaysia, Peru, and Tunisia being more racist/xenophobic. Thailand has become more racist/xenophobic over time. This can be seen in the following table.
How much you trust: People of another nationality
|
WVS5 |
WVS6 |
|||
|
Cases |
%/Total |
Cases |
%/Total |
|
|
Trust completely |
61 |
3.98% |
28 |
2.30% |
|
Trust somewhat |
291 |
18.97% |
153 |
12.80% |
|
Do not trust very much |
798 |
52.02% |
591 |
49.30% |
|
Do not trust at all |
384 |
25.03% |
417 |
34.70% |
|
No answer |
0 |
0% |
11 |
0.90% |
|
(N) |
1534 |
100.0% |
1200 |
100% |
|
Selected sample: Thailand 2007 (1200) |
Selected sample: Thailand 2013 (1200) |
|||
The difference between the valid percent comparing Wave 5 to Wave 6 is statistically significant at p<0.05 (P=<0.0001) z value 5.0569. Tested: Trust completely or somewhat = 352/1534 = 22.95% (WV5) versus 181/1189 = 15.22% (WV6): 2-sample z-test (two-tailed). This can be represented visually as follows:
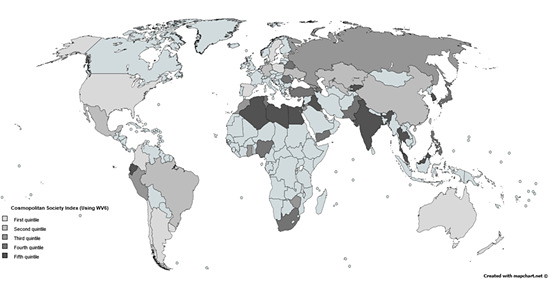
It is also possible to create a composite index of these four questions, which can be called the ‘Cosmopolitan Society Index’. For the Wave 5 Cosmopolitan Society Index, Thailand ranks in the lowest quintile and is fifth from the bottom, with only South Korea, Jordan, Viet Nam, and Iran being more racist/xenophobic:
For the Wave 6 Cosmopolitan Society Index, Thailand is second from the bottom out of 58 countries, with only South Korea being more racist/xenophobic. This is the complete Table:
|
Rank |
Score |
Country |
|
1 |
2.25 |
Sweden |
|
2 |
6.25 |
Poland |
|
3 |
7.00 |
Uruguay |
|
4 |
7.67 |
New Zealand* |
|
5 |
8.75 |
Australia |
|
6 |
9.25 |
Trinidad and Tobago |
|
7 |
12.00 |
Chile |
|
8 |
12.00 |
Spain |
|
9= |
17.25 |
Colombia |
|
9= |
17.25 |
United States |
|
11 |
17.75 |
Slovenia |
|
12 |
18.25 |
Argentina |
|
13 |
18.50 |
Brazil |
|
14= |
19.50 |
Taiwan |
|
14= |
19.50 |
Uzbekistan |
|
15 |
20.75 |
Netherlands |
|
16 |
23.00 |
Qatar |
|
17 |
23.75 |
Estonia |
|
18 |
24.75 |
Germany |
|
19 |
26.50 |
Kazakhstan |
|
20 |
26.75 |
Ukraine |
|
21 |
27.25 |
Mexico |
|
22 |
27.50 |
Rwanda |
|
23 |
28.50 |
China |
|
24 |
29.00 |
Zimbabwe |
|
25 |
29.50 |
Peru |
|
26 |
30.50 |
Georgia |
|
27 |
32.50 |
Singapore |
|
28 |
32.75 |
Morocco |
|
29 |
34.00 |
Bahrain |
|
30 |
34.25 |
Cyprus |
|
31= |
34.75 |
Jordan |
|
31= |
34.75 |
Russia |
|
33 |
35.00 |
Armenia |
|
34 |
35.50 |
Kuwait |
|
35 |
35.75 |
Ghana |
|
36= |
36.25 |
Nigeria |
|
36= |
36.25 |
Romania |
|
38 |
37.00 |
Belarus |
|
39 |
37.75 |
Yemen |
|
40 |
38.00 |
Japan |
|
41 |
39.00 |
South Africa |
|
42= |
39.25 |
Philippines |
|
42= |
39.25 |
Turkey |
|
44= |
39.50 |
Azerbaijan |
|
44= |
39.50 |
Pakistan |
|
46 |
39.50 |
Tunisia |
|
47 |
40.50 |
Iraq |
|
48 |
41.50 |
Algeria |
|
49 |
42.25 |
Kyrgyzstan |
|
50 |
42.50 |
Ecuador |
|
51= |
43.00 |
India |
|
51= |
43.00 |
Libya |
|
53 |
44.00 |
Palestine* |
|
54 |
44.67 |
Egypt* |
|
55 |
46.25 |
Malaysia |
|
56 |
46.50 |
Lebanon |
|
57 |
48.75 |
Thailand |
|
58 |
50.50 |
South Korea |
(*Average of only 3 values)
This can be seen in the following map:
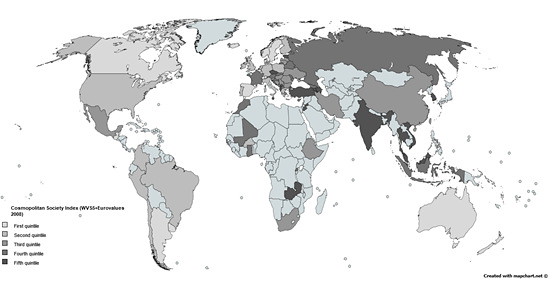
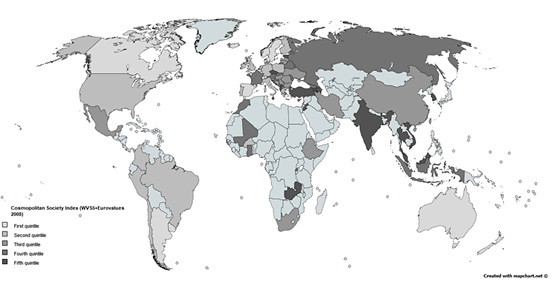
Using the European Values Survey, we can add more countries to the mix, but the 2015 version of the survey is not yet out. However, the World Values Survey Wave 5 combined with European Values Survey 2008 data gives us a similar picture, with Thailand again in the lowest quintile:
|
Rank |
Score |
Country |
|
1 |
1.00 |
Iceland |
|
2 |
1.50 |
Sweden |
|
3 |
3.50 |
Andorra |
|
4 |
5.00 |
Canada |
|
5 |
5.50 |
Norway |
|
6 |
6.25 |
Argentina |
|
7 |
9.00 |
Trinidad and Tobago |
|
8 |
9.50 |
Guatemala* |
|
9 |
11.00 |
Denmark |
|
10 |
11.00 |
Uruguay |
|
11 |
12.25 |
Switzerland |
|
12 |
13.00 |
Australia |
|
13= |
13.50 |
Belgium* |
|
13= |
13.50 |
New Zealand* |
|
15 |
14.00 |
Spain |
|
16 |
14.25 |
Portugal* |
|
17 |
15.50 |
Great Britain |
|
18 |
17.25 |
United States |
|
19 |
21.00 |
Brazil |
|
20= |
22.00 |
Colombia* |
|
20= |
22.00 |
Netherlands |
|
22 |
22.25 |
Chile |
|
23 |
22.50 |
Peru |
|
24 |
23.00 |
Finland |
|
25= |
23.50 |
Burkina Faso |
|
25= |
23.50 |
Germany |
|
27 |
24.00 |
Italy |
|
28 |
25.00 |
Greece* |
|
29 |
25.25 |
Poland |
|
30 |
26.00 |
Ireland* |
|
31 |
28.50 |
Luxembourg* |
|
32 |
28.75 |
South Africa |
|
33 |
29.25 |
Mexico |
|
34 |
31.50 |
Taiwan |
|
35= |
31.75 |
Hungary |
|
35= |
31.75 |
Ukraine |
|
37= |
33.50 |
Latvia* |
|
37= |
33.50 |
Slovenia |
|
39= |
35.00 |
Bosnia Herzegovina* |
|
39= |
35.00 |
Serbia** |
|
41 |
36.25 |
Bulgaria |
|
42 |
36.25 |
Iran* |
|
43 |
36.50 |
Lithuania* |
|
44 |
36.75 |
China |
|
45 |
37.00 |
Romania |
|
46 |
37.50 |
Ethiopia |
|
47 |
38.00 |
Slovak Re* |
|
48 |
38.25 |
Cyprus |
|
49 |
39.75 |
Mali |
|
50 |
40.75 |
Georgia |
|
51= |
42.50 |
France |
|
51= |
42.50 |
Moldova |
|
53 |
42.75 |
Russia |
|
54 |
43.50 |
Austria* |
|
55 |
46.00 |
Croatia* |
|
56 |
46.25 |
Ghana |
|
57 |
48.00 |
Montenegro* |
|
58 |
50.00 |
Belarus* |
|
59 |
50.75 |
Morocco |
|
60 |
51.50 |
Macedonia* |
|
61= |
52.75 |
Indonesia |
|
61= |
52.75 |
Rwanda |
|
63 |
53.25 |
Malaysia |
|
64 |
53.25 |
Zambia |
|
65= |
53.50 |
Czech Republic |
|
65= |
53.50 |
Turkey |
|
67 |
55.25 |
India |
|
68 |
55.50 |
Thailand |
|
69 |
57.75 |
South Korea |
|
70= |
59.00 |
Estonia* |
|
70= |
59.00 |
Viet Nam |
|
72 |
59.50 |
Jordan |
|
73 |
60.50 |
Malta* |
|
74 |
63.00 |
Azerbaijan* |
|
75 |
64.00 |
Kosovo* |
|
76 |
71.00 |
Albania* |
|
77 |
73.50 |
Armenia* |
(*Average of only 2 values; **Average of only 3 values)
Note that this map and table show 2007 data for Thailand, before it became more racist/xenophobic. In addition, there are a few caveats with data of this sort. Firstly, it assumes people tell the truth. Of course, people in one country may be lying about how racist/xenophobic they are. However, it is almost impossible to test veracity, so we have to take the results as they are. Another point is that people may be thinking of the ‘worst case scenario’, for example traditional enemies, when they are asked questions of this sort. For example, Russians may immediately think of Ukrainians or Greeks of Turks.
In the case of Thailand, there are multiple ‘worst case scenarios’ according to such common stereotypes as are due to historical or current events or media portrayals. Following such negative stereotypes, a Central Thai replying to questions on such surveys may be thinking of hill tribe drug dealers who slash and burn, Lao Red Shirts, Northern Thai Thaksin supporters and secessionists, Myanmar destroyers of capitals and illegal immigrants, Malay Muslim bandits and insurgents, Cambodian stealers of temples and political agitators, Vietnamese business competitors, or interfering American/European/United Nations diplomats and staff. The sheer number of possible ‘worst case scenarios’ in Thailand thus appears to be a problem in itself.
Because of various social pathologies, which may indeed have their root in historical disjunctures involving other countries or minorities, a racist or xenophobic person adopts an ultra-authoritarian viewpoint (as explored in the case of Thailand in terms of paternalism here and the general population here) and experiences a version of reality dominated by finding fault in internal ‘Others’ (such as minorities) or external ‘Others’ (such as foreigners), which has historically led to conflict unless defused. The result, in the case of Thailand, appears to be a Quasi-Imperialistic, Hyper-Bureaucratized, Hyper-Nationalistic Nation State with Advanced Praetorianism, Advanced Police State Capabilities, and a Neo-Colonial Economy, as discussed here.
Moreover, the high, and worsening, levels of racism and xenophobia pose a threat to the cosmopolitan image of the country promoted by successive Thai governments following the Cold War, as epitomized in the Amazing Thailand campaign. This worsening image may prompt a reduction in inwards investment, a purely pragmatic argument which would suggest the government should focus on reducing the causes of racism. An urgent program to reduce the causes of racism and xenophobia, whether they be inaccurate history books, ultranationalist radicals terrorizing the streets of Bangkok, regimented schoolchildren incapable of critical thinking, unrestrained forms of militarism used against ethnic minorities, or harassment of the foreign media (whose goodwill is crucial to a country’s economic situation) should also be immediately instituted by the NCPO. Such a campaign can be enhanced via such methods as promoting pluralism using the 12 Core Values of Thai People or through adopting pro-diversity state policies such as the draft National Language Policy.
This course of action is absolutely necessary if Thailand’s international image is not to be tarnished and confidence in its creative sector, heavily reliant on pluralism and foreign workers and key to developing the economy out of the middle income trap, is not to suffer. Unfortunately, such a situation becomes increasingly likely as economic downturns also increase racism and xenophobia, which would create a downwards spiral due to a general lack of confidence in the country, a crisis from which Thailand may not emerge for years.